Zipline and PyFolio abstract away the complexities of the backtesting and performance/risk analysis aspects of algorithmic trading strategies.
Backtesting should include all relevant factors, such as slippage and trading costs.
Zipline is one of the most advanced open source Python libraries for algorithmic trading backtesting engines.
PyFolio is an open-source Python performance and risk analysis library consisting of financial portfolios that are closely integrated with Zipline.
Installing Zipline
conda create -n zipline_env python=3.6
conda activate zipline_env
conda install -c conda-forge zipline
Install PyFolio
pip install pyfolioImporting market data into a Ziplin/PyFolio backtesting system
Zipline introduces two market data-specific terms – bundle and ingest:
- A bundle is an interface for incrementally importing market data into Zipline’s proprietary database from a custom source.
- An ingest is the actual process of incrementally importing the custom source market data into Zipline’s proprietary database; the data ingest is not automatically updated. Each time you need fresh data, you must re-ingest the bundle.
By default, Zipline supports these bundles:
- Historical Quandl bundle (complimentary daily data for US equities up to 2018)
- .csv files bundle
Importing data from the historical Quandl bundle
First, in the activated zipline_env environment, set the QUANDL_API_KEY environment variable to your free (or paid) Quandl API key. Then, ingest the quandl data.
On Mac/Linux, add the following command to ~/.bash_profile for user-based operations or ~/.bashrc for non-login interactive shells:
export QUANDL_API_KEY=XXXXXXXImporting data from the CSV files bundle
The default CSV bundle requires the CSV file to be in open, high, low, close, volume (OHLCV) format with dates, dividends, and splits:
date, open, high, low, close, volume, dividend, split
To use the custom CSV files bundle, follow these steps:
- Create a directory for CSV files
- Copy the CSV files to the created directory
- Edit the .py file extension in the .zipline/extension.py directory
import pandas as pd

from zipline.data.bundles import register
from zipline.data.bundles, csvdir import csvdir_equities

register(
    'packt-csvdir-bundle',
    dsvdir_equities(
        ['daily'],
        'data source location folder',
    ),
    calendar_name='NYSE',
    start_session=pd.Timestamp('2015-5-15', tz='utc'),
    end_session=pd.Timestamp('2020-05-14', tz='utc')
)
4. Ingest the bundle
zipline ingest -b packt-csvdir-bundleImporting data from custom bundles
Importing data from Quandl’s EOD US Stock Prices data
The advantages of this service, compared to others, are as follows:
- Quandl is deeply integrated into Zipline and you can download the history of all the stocks using one command.
- There is no hard limit in terms of the number of API calls you can make per month, unlike other providers.
Installing the custom bundle:
1. Find the location of the bundles
python -c "improt zipline.data.bundles as bdl; print(bdl.__path__)"2. Copy the quandl_eod.py file to the directory
3. In the same directory, modify the __init__.py file
from . import quandl_eod # noqaAn example of the full __init__.py file
# These imports are necessary to force module-scope registercalls to happen.
from . import quandl # noqa
from . import csvdir # noqa
from . import quandl_eod # noqa
from .core import (
UnknownBundle,
bundles,
clean,
from_bundle_ingest_dirname,
ingest,
ingestions_for_bundle,
load,
register,
to_bundle_ingest_dirname,
unregister,
)


__all__ = [
'UnknownBundle',
'bundles',
'clean',
'from_bundle_ingest_dirname',
'ingest',
'ingestions_for_bundle',
'load',
'register',
'to_bundle_ingest_dirname',
'unregister',
]
Ensure set the QUANDL_API_KEY environment variable, and run the ingest command:
zipline ingest -b quandl_eodThe actual source code of quandl_eod.py is self-explanatory. The quandl_eod_bundle function, which is annotated with @bundles.register(“quandl_eod”), defines the download process:
@bundles.register("quandl_eod")
def quandl_eod_bundle(environ,
asset_db_writer,
minute_bar_writer,
daily_bar_writer,
adjustment_writer,
calendar,
start_session,
end_session,
cache,
show_progress,
output_dir):
"""
quandl_bundle builds a daily dataset using Quandl's WIKI
Prices dataset.
For more information on Quandl's API and how to obtain an
API key,
please visit https://docs.quandl.com/docs#section-
authentication
"""
api_key = environ.get("QUANDL_API_KEY")
if api_key is None:
    raise ValueError(
        "Please set your QUANDL_API_KEY environment variable and retry."
    )
raw_data = fetch_data_table(
    api_key, show_progress,
    environ.get("QUANDL_DOWNLOAD_ATTEMPTS", 5)
)
asset_metadata = gen_asset_metadata(raw_data[["symbol", "date"]], show_progress)

asset_db_writer.write(asset_metadata)

symbol_map = asset_metadata.symbol
sessions = calendar.sessions_in_range(start_session, end_session)

raw_data.set_index(["date", "symbol"], inplace=True)
daily_bar_writer.write(
    parse_pricing_and_vol(raw_data, sessions, symbol_map),
    show_progress=show_progress,
)
raw_data.reset_index(inplace=True)
raw_data["symbol"] = \
raw_data["symbol"].astype("category")
raw_data["sid"] = raw_data.symbol.cat.codes
adjustment_writer.write(
    splits=parse_splits(
        raw_data[["sid", "date", "split_ratio"]].loc[raw_data.split_ratio != 1],
        show_progress=show_progress,
    ),
    dividends=parse_dividends(
        raw_data[["sid", "date", "ex_dividend"]].loc[raw_data.ex_dividend != 0],
        show_progress=show_progress,
    ),
)
The steps that are involved in this process are as follows:
1. Download all the EOD data.
2. Generate the metadata.
3. Apply the trading calendar.
4. Apply the corporate events.
Importing data from Yahoo Finance and IEX paid data
The installation steps:
1. Download the repository from https://github.com/hhatefi/zipline_bundles.
2. Merge the repository’s \zipline_bundles-master\lib\extension.py file with C:\Users\<username>\.zipline\extension.py on Windows or ~/.zipline/extension.py on Mac/Linux. If the latter file does not exist, just copy and paste the file.
3. Edit the start and end dates in the following code:
register('yahoo_direct', # bundle's name direct_ingester('YAHOO', every_min_bar=False, symbol_list_env='YAHOO_SYM_LST',
# the environment variable holding the comma separated list of assert names
downloader=yahoo.get_downloader(start_date='2010-01-01', end_date='2020-01-01'),
),
    calendar_name='NYSE',
)
register('iex', # bundle's name direct_ingester('IEX Cloud', every_min_bar=False, symbol_list_env='IEX_SYM_LST',
# the environemnt variable holding the comma separated list of assert names
downloader=iex.get_downloader(start_date='2020-01-01', end_date='2020-01-05'),
filter_cb=lambda df: df[[cal.is_session(dt) for dt in df.index]]
),
calendar_name='NYSE',
)The full file:
#!/usr/bin/env python
# -*- coding: utf-8 -*-

from pathlib import Path
from zipline.data.bundles import register
from zipline.data.bundles.ingester import csv_ingester
# ingester.py need to be placed in zipline.data.bundles

_DEFAULT_PATH = str(Path.home()/'.zipline/csv/yahoo')

register(
    'yahoo_csv',
    csv_ingester('YAHOO',
        every_min_bar=False,
        # the price is daily
        csvdir_env='YAHOO_CSVDIR',
        csvdir=_DEFAULT_PATH,
        index_column='Date',
        column_mapper={'Open': 'open',
                       'High': 'high',
                       'Low': 'low',
                       'Close': 'close',
                       'Volume': 'volume',
                       'Adj Close': 'price',
        },
     ),
     calendar_name='NYSE',
)

from zipline.data.bundles.ingester import direct_ingester
from zipline.data.bundles import yahoo

register('yahoo_direct', # bundle's name
         direct_ingester('YAHOO',
                         every_min_bar=False,
                         symbol_list_env='YAHOO_SYM_LST',
# the environemnt variable holding the comma separated list of assert names
                         downloader=yahoo.get_downloader(start_date='2010-01-01', end_date='2020-01-01'),
                        ),
                        calendar_name='NYSE',
)

from zipline.data.bundles import iex
import trading_calendars as tc

cal=tc.get_calendar('NYSE')

register('iex', # bundle's name
         direct_ingester('IEX Cloud',
                         every_min_bar=False,
                         symbol_list_env='IEX_SYM_LST', # the environemnt variable holding the comma separated list of assert names
                         downloader=iex.get_downloader(start_date='2020-01-01',
                         end_date='2020-01-05'
                        ),
                        filter_cb=lambda df: df[[cal.is_session(dt) for dt in df.index]]
        ),
        calendar_name='NYSE',
)
4. Find the location of the bundles directory
python -c "import zipline.data.bundles as bdl; print(bdl.__path__)"5. Copy the Copy \zipline_bundles-master\lib\iex.py, \zipline_bundles-master\lib\ingester.py, and \zipline_bundles-master\lib\yahoo.py repository files into your Zipline bundles directory;
6. Set the tickers of interest as environmental variables.
# For Widnows
set YAHOO_SYM_LST=GOOG,AAPL,GE,MSFT
set IEX_SYM_LST=GOOG,AAPL,GE,MSFT
# For Mac/Linux
export YAHOO_SYM_LST=GOOG,AAPL,GE,MSFT
export IEX_SYM_LST=GOOG,AAPL,GE,MSFT7. Set an IEX token
# For Windows
set IEX_TOKEN=xxx
For Mac/Linux
export IEX_TOKEN=xxx8. Ingest the data
zipline ingest -b yahoo_direct
zipline ingest -b iex
Structuring Zipline/PyFolio backtesting modules
Typical Zipline backtesting code defines three functions:
- initialise: This method is called before any simulated trading happens; it’s used to enrich the context object with the definition of tickers and other key trading information. It also enables commission and slippage considerations.
- handle_data: This method downloads the market data, calculates the trading signals, and places the trades. This is where you put the actual trading logic on entry/exit positions.
- analyse: This method is called to perform trading analytics.
Finally, the code defines the start date and the end date and performs backtesting by calling the run_algorithm method. This method returns a comprehensive summary of all the trades to be persisted to a file.
Trading happens every day
from zipline import run_algorithm
from zipline.api import order_target_percent, symbol
from datetime import datetime
import pytz
import matplotlib.pyplot as plt
import pandas as pd
import pyfolio as pf
from random import random

def initialize(context):
    pass

def handle_data(context, data):
    pass

def analyze(context, perf):
    returns, positions, transactions = \
    pf.utils.extract_rets_pos_txn_from_zipline(perf)
    pf.create_returns_tear_sheet(returns, benchmark_rets = None)

start_date = pd.to_datetime('1996-1-1', utc=True)
end_date = pd.to_datetime('2020-12-31', utc=True)

results = run_algorithm(start = start_date, end = end_date, initialize = initialize, analyze = analyze, handle_data = handle_data, capital_base = 10000, data_frequency = 'daily', bundle ='quandl')
Trading happens on a custom schedule
from zipline import run_algorithm
from zipline.api import order_target_percent, symbol, set_commission, schedule_function, date_rules, time_rules fromdatetime import datetime
import pytz
import matplotlib.pyplot as plt
import pandas as pd
import pyfolio as pf
from random import random
def initialize(context):
# definition of the stocks and the trading parameters, e.g. commission
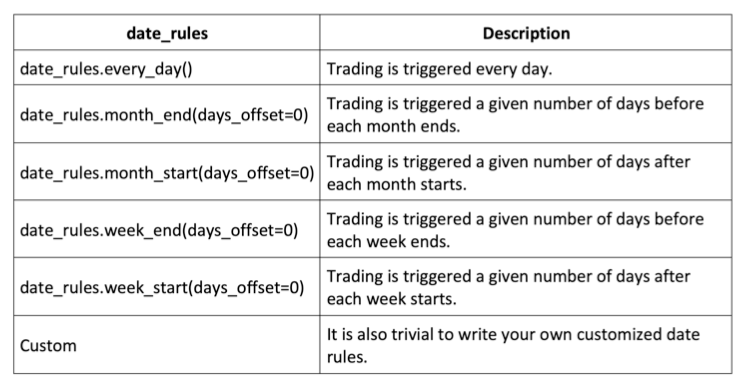
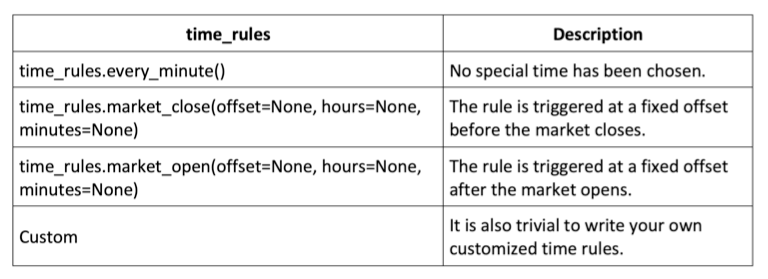
schedule_function(handle_data, date_rules.month_end(), time_rules.market_open(hours=1))
def handle_data(context, data):
pass
def analyze(context, perf):
returns, positions, transactions = pf.utils.extract_rets_pos_txn_from_zipline(perf)
pf.create_returns_tear_sheet(returns, benchmark_rets = None)
start_date = pd.to_datetime('1996-1-1', utc=True)
end_date = pd.to_datetime('2020-12-31', utc=True)
results = run_algorithm(start = start_date, end = end_date, initialize = initialize, analyze = analyze, capital_base = 10000, data_frequency = 'daily', bundle ='quandl')Specify various date rules
Specify time rules
Reviewing the key Zipline API reference
Types of orders
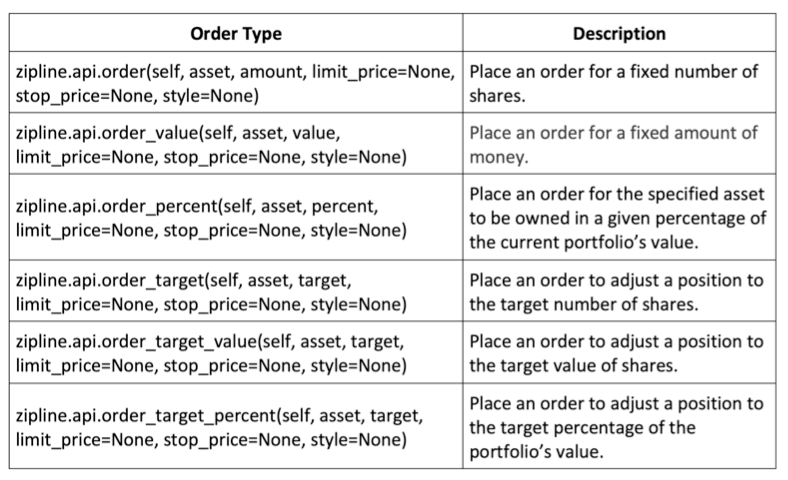
The order-placing logic is typically placed in the handle_data method.
def handle_data(context, data):
    price_hist = data.history(context.stock, "close", context.rolling_window, "1d")

    order_target_percent(context.stock, 1.0 if price_hist[-1] > price_hist.mean() else 0.0)
Commission models
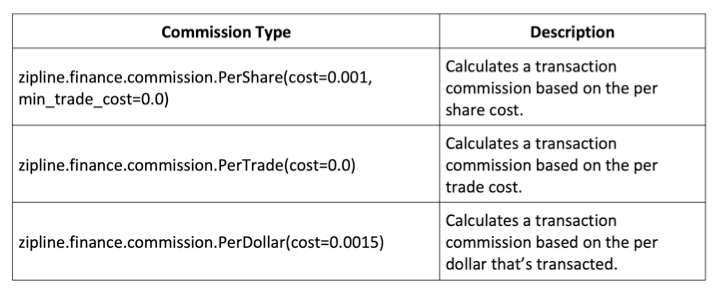
This logic is typically placed into the initialise method.
Define initialize(context):
    context.stock = symbol('AAPL')
    context.rolling_window = 90
    set_commission(PerTrade(cost=5))
Slippage models
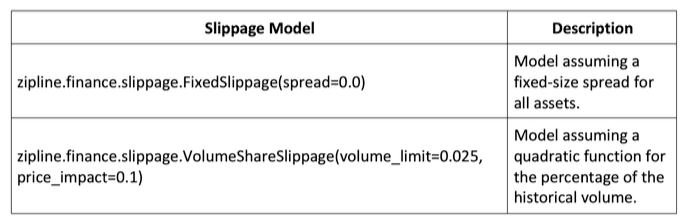
The slippage model should be placed in the initialise method.
def initialize(context):
    context.stock = symbol('AAPL')
    context.rolling_window = 90
    set_commission(PerTrade(cost=5))
    set_slippage(VolumeShareSlippage(volume_limit=0.025, price_impact=0.05))
Running Zipline backtesting from the command line
The following command runs the backtesting strategy defined in the job.py Python script and saves the resulting DataFrame in the job_results.pickle pickle file:
zipline run -f job.py --start 2016-1-1 --end 2021-1-1 -o job_result.pickle --no-benchmarkRisk management with PyFolio
Various risks are involved in algorithmic trading:
- Market risk
- Regulatory risk
- Software implementation risk
- Operational risk
Generate hypothetical PnLs for a trding strategy with a slight positive bias and hypothetical positons with no bias:
dates = pd.date_range('1992-01-01', '2012-10-22')
np.random.seed(1)
pnls = np.random.randint(-990, 1000, size=len(dates))
# slight positive bias

pnls = pnls.cumsum()

positions = np.random.randint(-1, 2, size=len(dates))
positions = positions.cumsum()

strategy_performance = pd.DataFrame(index=dates, data={'PnL': pnls, 'Position': positions})
Review how the PnL varies over the course of 20 years:
strategy_performance['PnL'].plot(figsize(12, 6), color='black', legend='PnL')Market volatility, PnL variance, and PnL standard deviation
Market volatility is defined as the standard deviation of prices.
PnL variance is used to measure the magnitude of volatility in the strategy’s performance/returns.
Compute the PnL standard deviation over a rolling 20-day period:
strategy_performance['PnLStdev'] = strategy_performance['PnL'].rolling(20).std().fillna(method='backfill')
strategy_performance['PnLStdev'].plot(figsize=(12,6), color='black', legend='PnLStdev')
Trade-level Sharpe ratio
The trade-level Sharpe ratio compares average PnLs (strategy returns) relative to PnL standard deviations (strategy volatility). Compared to the standard Sharpe ratio, the Trade Level Sharpe Ratio assumes that the risk-free rate is 0 since we don’t roll over positions, so there is no interest charge. This assumption is realistic for intraday or daily trading.
Generate the Sharpe ratio
daily_pnl_series = strategy_performance['PnL'].shift(-1) - strategy_perforamnce['PnL']
daily_pnl_series.fillna(0, inplace=True)

avg_daily_pnl = daily_pnl_series.mean()
std_daily_pnl = daily_pnl_series.std()

sharpe_ratio = avg_daily_pnl/std_daily_pnlannualized_sharpe_ratio = sharpe_ratio * np.sqrt(252)Interpret the Sharpe ratio:
- A ratio of 3.0 or higher is excellent.
- A ratio > 1.5 is very good.
- A ratio > 1.0 is acceptable.
- A ratio < 1.0 is considered sub-optimal.
Maximum drawdown
Maximum drawdown is the peak-to-trough decline in a trading strategy’s cumulative PnL over a period of time.
strategy_performance['PnL'].plot(figsize=(12,6), color='black', legend='PnL')

plt.axhline(y=28000, color='darkgrey', linestyle='--', label='PeakPnLBeforeDrawdown')
plt.axhline(y=-15000, color='darkgrey', linestyle=':', label='TroughPnLAfterDrawdown')
plt.vlines(x='2000', ymin=-15000, ymax=28000,label='MaxDrawdown', color='black', linestyle='-.')

plt.legend()
Strategy stop rule — stop loss/maximum loss
The stop loss barrier can be set using historical maximum drawdown values.
Once a strategy is stopped, we can decide to shut down the strategy forever or just shut it down for a certain period of time, or even shut it down until certain market conditions change. This decision depends on the strategy’s behaviour and its risk tolerance.