Hypotheses concerning the population correlation coefficient may be two- or one-sided, as we have seen in other tests. Let ρ represent the population correlation coefficient. The possible hypotheses are as follows:
Two sided: H0: ρ = 0 versus Ha : ρ ≠ 0
One sided (right side): H0: ρ ≤ 0 versus Ha : ρ > 0
One sided (left side): H0: ρ ≥ 0 versus Ha : ρ < 0
Parametric Test of a Correlation
Pearson correlation, the bivariate correlation, or simply the correlation.
Consider two variables, X and Y. The sample correlation, , is as follows:
where sXY is the sample covariance between the X and Y variables, sX is the standard deviation of the X variable, and sY is the standard deviation of the Y variable.
Drop the subscript to represent the correlation as simply r.
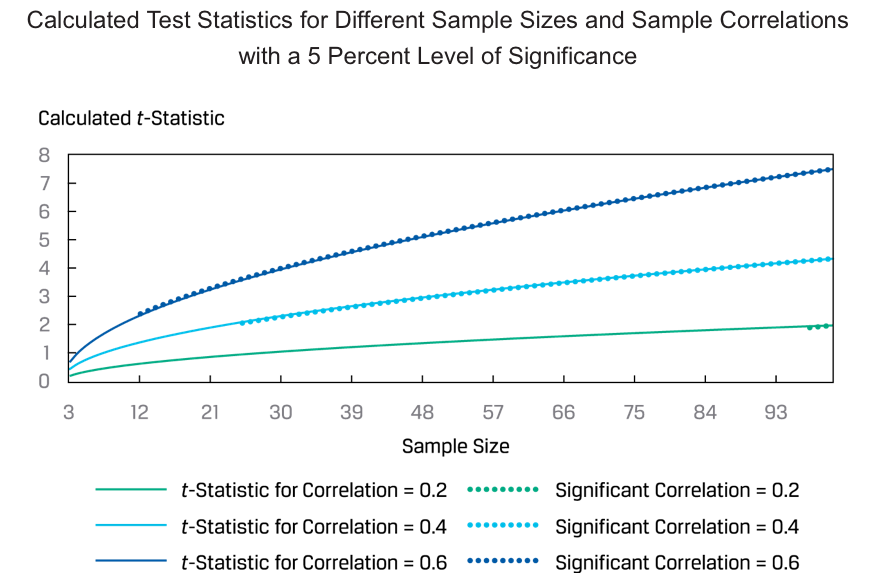
If the two variables are normally distributed, we can test to determine whether the null hypothesis (H0: ρ = 0) should be rejected using the sample correlation, r. The formula for the t-test is as follows:
Non-Parametric Test of Correlation: The Spearman Rank Correlation Coefficient
The Spearman rank correlation coefficient is essentially equivalent to the Pearson correlation coefficient as defined earlier, but it is calculated on the ranks of the two variables (e.g., X and Y) within their respective samples. The calculation of rS requires the following steps:
- Rank the observations on X from largest to smallest.
- Calculate the difference, di, between the ranks for each pair of observations on X and Y, and then calculate di2 (the squared difference in ranks).
- With n as the sample size, the Spearman rank correlation is given as follows: