What is the 1-2-3 Trading Signal?
It’s a bottom, a correction, retest that does not go beyond the original bottom, and then, rebound beyond the correction.
Point 1: This is the bottom.
Point 2: this is the correction.
Point 3: This is the retest the DOES NOT GO BEYOND point 1. If it does then all bets are off. The pattern does not exist. Scratch it off and move on.
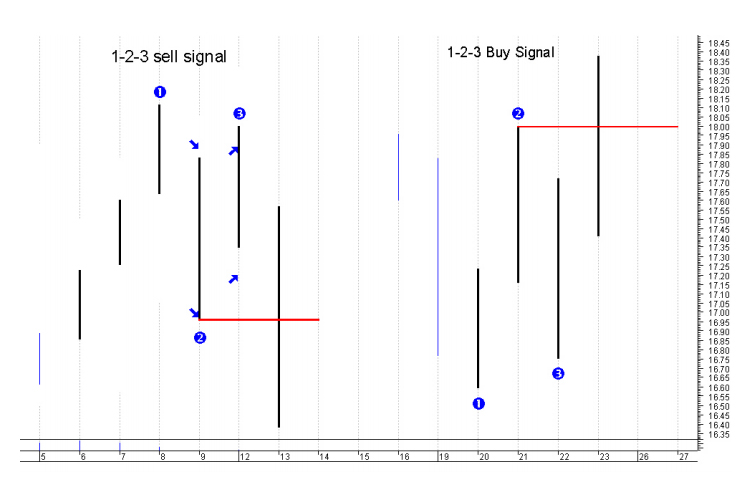
Perform an 1-2-3 Pattern
- Get a blank piece of paper and a pen/pencil.
- Starting at the top left-hand corner draw a diagonal line to the centre of the page.
- Where you stop mark this with a BIG NUMBER 1.
- Now from this point draw another diagonal line towards the top right-hand corner but only go about half way up.
- Mark this point with a BIG NUMBER 2.
- Draw a diagonal line from the number 2 point, parallel to the first line, down towards the bottom right hand corner. BUT DO NOT GO ANYWHERE NEAR AS FAR DOWN AS YOUR NUMBER ONE POINT. This line should be your shortest one. Make it about half the length of your number 2 line.
- Mark this point with a BIG NUMBER 3.
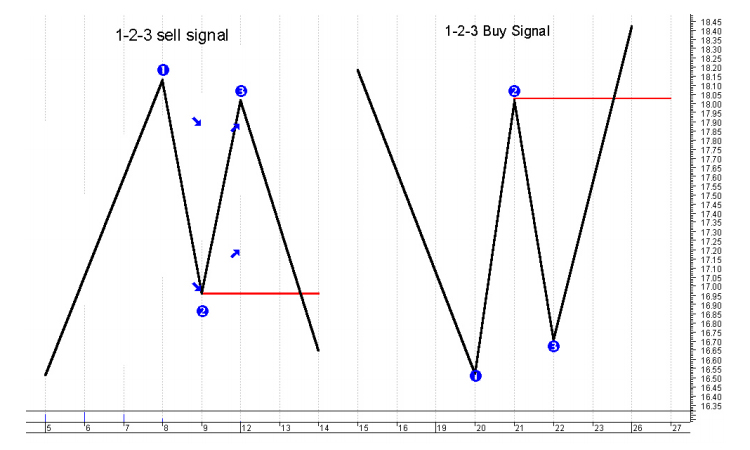
- Now you have a zig-zag pattern, marked clearly as a 1-2-3. Now draw a flat, horizontal line right on top of the number two point. On top of this line write: BUY HERE!
- Now imagine this is a stock you have been observing and it has formed a 1-2-3 bottom. IF THAT HORIZONTAL LINE across the number two is taken out then you have a valid buy.
- For a 1-2-3 topping formation that gives a valid sell signal simply reverse the whole procedure.
- Practice, practice and practice some more until the pattern is firmly fixed in your mind. It takes a little time and effort to grasp the pattern but it is like riding a bike, when you get it right, you will never have to learn it again.
This is how your drawing should have looked:
There is nothing wrong with 1-2-3 formations forming over several bars as opposed to the one bar corrections.
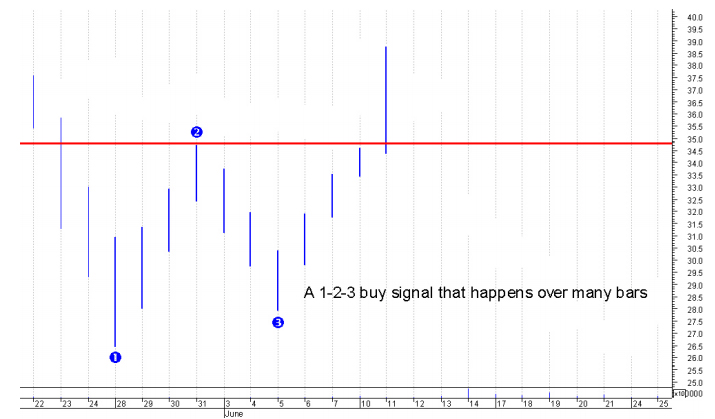
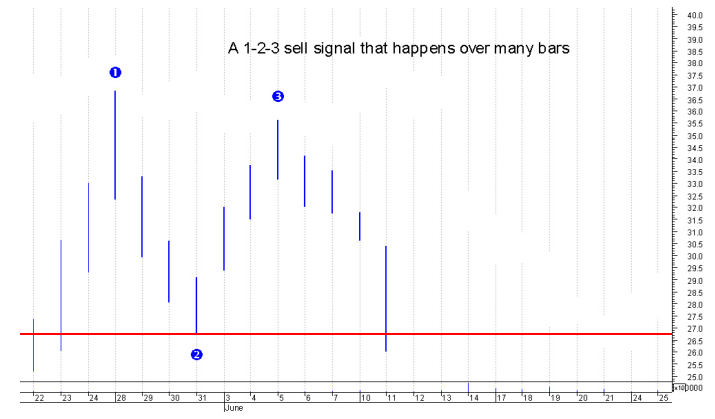
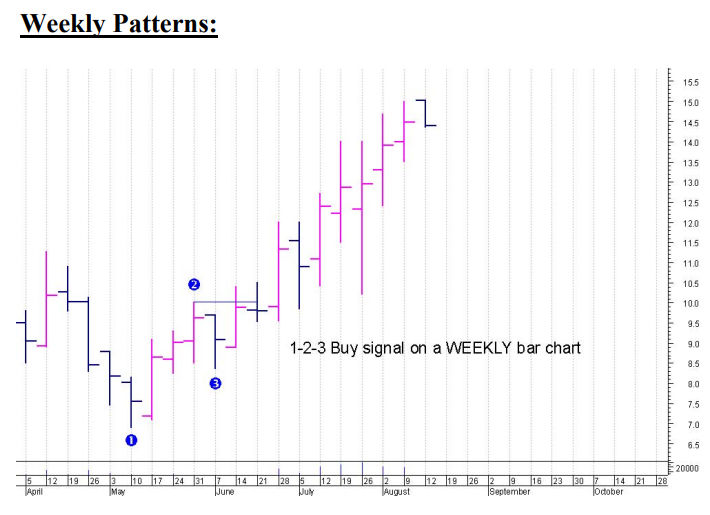
Let’s look at weekly and monthly charts, just to prove that the 1-2-3 pattern is valid in these time frames.
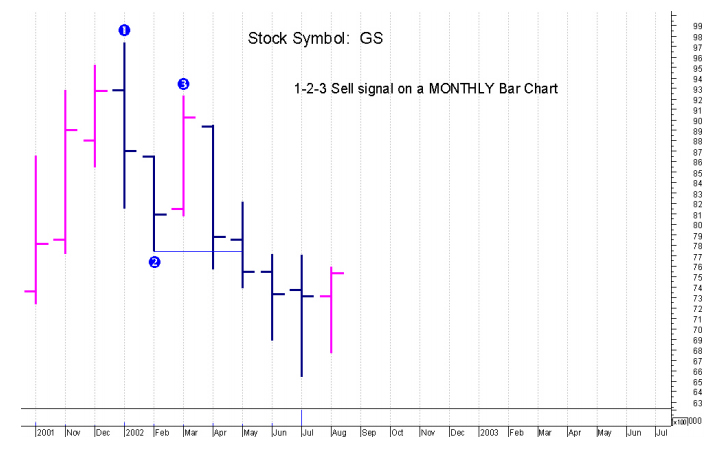
Let’s prove that this 1-2-3 pattern is as valid on a monthly chart as it is on any other frame.
The 1-2-3 patterns appear on all of the charts, bar, lines, Renko, P+F, candlestick. It makes absolutely no difference. The exact same pattern plays out the same.
The Entry
In a buy point, buy at a slightly lower price than the breakout of the number two-point.
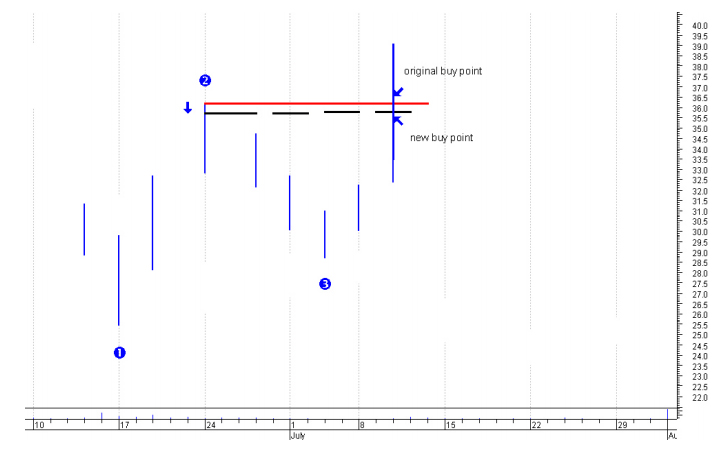
Instead of simply buying at the breakout and joining the mass of other buy orders as they scramble to get onboard the break out just move your buy order in so as to enter the market before most others. This will cut down on your slippage and ensures you will get a big initial move on your order.
Now by how far you move this buy/sell “in” is your choice. There is no exact scientific amount. Bear in mind you are simply trying to enter the market before the masses. So, you do not want to get in too early where the stock/future never breaks out beyond the number two-point. On the other hand, you want to get in with plenty to spare before the masses enter on the breakout. Remember to keep a tight (no more than 10%) initial stop loss once you have entered your trade.
The Exist
Existing a trade is more important than the entry. This is where the money is made.
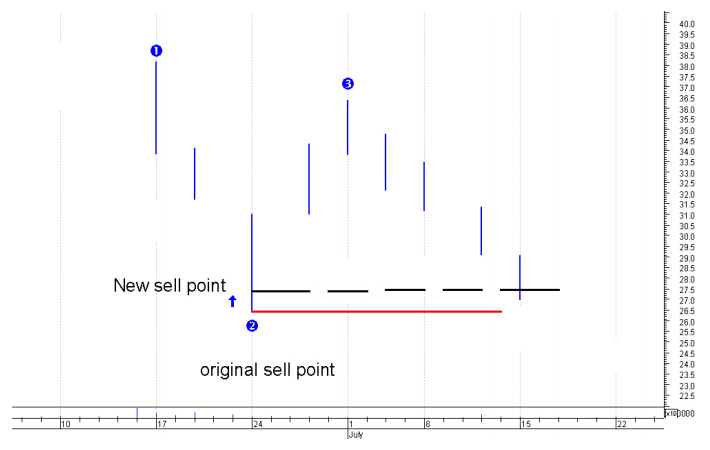
Set your initial stop loss relatively tight. For stocks, you do not like to lose more than 10% on futures this will have to be a predetermined $$ amount. You really should not be risking more than 3% of your total equity on any one trade. So, if your account is $20,000 on each trade your maximum risk is no more than: (3% of $20,000) $600.
Once you have a 25% gain then move your stop to break even.
If the stock doubles back from here and takes your stop-out you have lost only your brokers transaction. You left 20% profits on the table. That’s the “chance” we took in the HOPE of making a much bigger profit. Once you have a gain of over 25% simply protect half of those profits until you are stopped out. Once you have a 100% gain then protect 75% of those profits until you have been stopped out.

