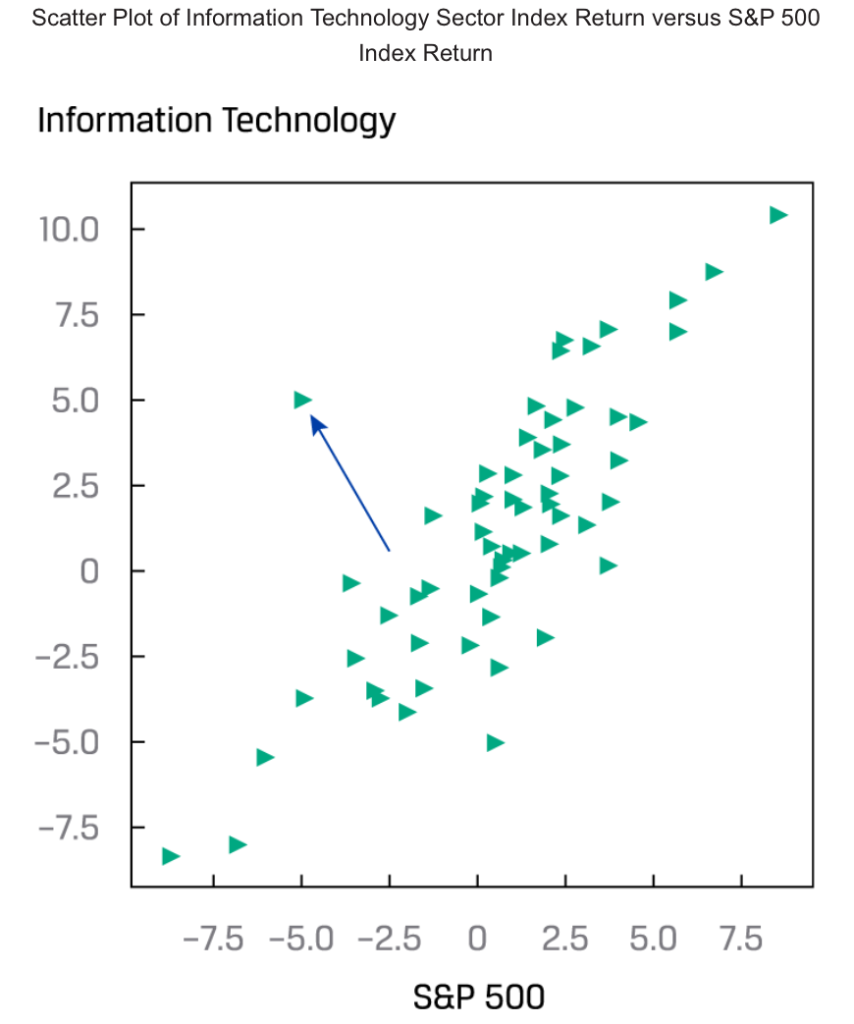
Scatter Plot
Covariance and Correlation
Correlation is a measure of the linear relationship between two random variables.
The sample covariance () is a measure of how two variables in a sample move together:
The sample correlation coefficient is a standardised measure of how two variables in a sample move together. The sample correlation coefficient () is the ratio of the sample covariance to the product of the two variables’ standard deviations:
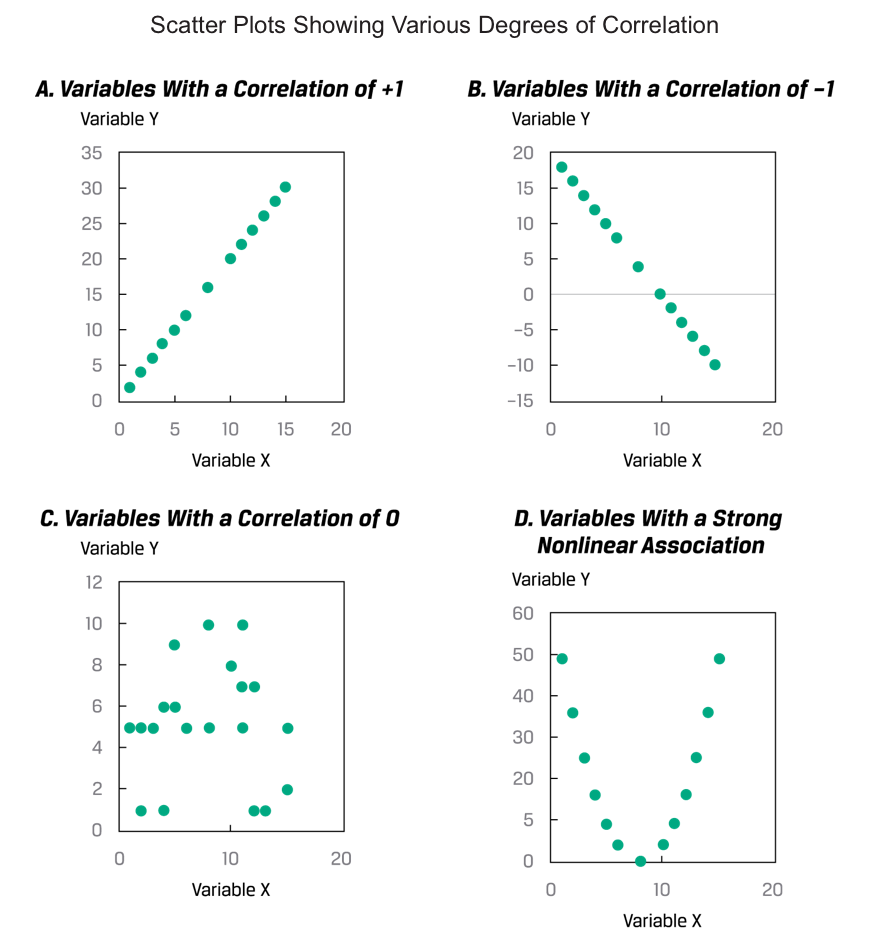
Properties of Correlation
- Correlation ranges from -1 and +1 for two random variables, X and Y: .
- A correlation of 0, termed uncorrelated, indicates an absence of any linear relationship between the variables.
- Apositive correlation close to -1 indicates a strong positive linear relationship. A correlation of 1 indicates a perfect linear relationship.
- A negative correlation close to -1 indicates a strong negative (i.e., inverse) linear relationship. A correlation of -1 indicates a perfect inverse linear relationship.
Limitations of Correlation Analysis
The term spurious correlation has been used to refer to:
- correlation between two variables that reflects chance relationship in a particular dataset;
- correlation induced by a calculation that mixes each of two variables with a third variable; and
- correlation between two variables arising not from a direct relation between them but from their relation to a third variable.